Kaggle Done Quick: Animal Shelter
by: Abbie Popa
This is the first post in what will hopefully become a series. For this project I wanted to see how far I could get with a kaggle dataset in under four hours. Because the topic interested me, I dove into Kaggle’s animal shelter dataset.
For this dataset, kaggle asks that you predict which dogs and cats will have each of five outcomes: Adoption, Died, Euthanasia, Return to Owner, and Transfer. Potential predictors include Animal Type (dog versus cat), breed, color, sex, and age. For a first attempt I decided to use multinomial logistic regression. The possible outcomes are discreet and unordered, which is what multinomial logistic regression was designed to predict. I performed said regressions using the nnet package for R.
The first decision I made was that separate models were necessary for dogs and cats, given that they are literally different animals. It is definitely not necessary that dogs and cats would have the same predictors.

We adopted our cat, Ripley, from a local shelter.
A quick examination of the data yields a few important findings for preprocessing. First, there are 1380 dog breeds alone. This is far too many categories to be useful for a model. Based on real world experience I rebinned the breeds as dogs who were pit bulls, dogs who were mutts, and dogs who were pure bred. In the final model I tested the prediction power of being identified as a mutt and as a pit bull and only pit bull significantly increased AIC of the model. In fact, being a pit bull was the strongest predictor in my data set, with pit bulls much more likely to receive euthanasia and much less likely to be adopted. This is an actionable insight from these data. Perhaps shelters could organize educational endeavors to reduce the stigma associated with pit bulls. Or offer potential owners obedience training for their pit bulls.

Similarly, for sex of tha animals there are six levels. However, each string provides two pieces of information. First, whether the animal is male or female, and second whether they are spayed/neutered or intact. In order to capture both of these dichotomies I split the data from this field into two fields, one for the sex of the animal and one for their reproductive status.

Next, in the case of age the information is given in a not particularly useful manner (i.e., “3 years” or “2 weeks”). For this project I grouped this into categories of infant, puppy, etc. I would like to redo this analysis at some point looking at continuous age to see which is more effective. Before checking I though categories might be more predictive as many shelters and website list animals in this way rather than giving exact ages, but it would be good to check to be sure. I coded this as an ordinal variable, on the assumption that puppies were the most often adopted and senior dogs the least often adopted.
Finally, I recoded color in a similar manner to breed. Color initially had 366 levels, and I recoded it down to five including “multi.”
From here, I checked if each predictor alone was significantly associated with the outcome types. Since all were, I iteratively added them to my multinomial logistic regression model and checked that each addition significantly increased the AIC of the model. The final model included pit bull status, sex, reproductive status, and age. A few noteworthy things, first, all outcomes are not equally likely. Fortunately, adoption is the most likely outcome with 42% of dogs getting adopted. Second, though age is not particularly more informative from a strict AIC point of view than the other predictors, it greatly enriches the possible outcomes. Without age, the outcome matrix (rows are predicted outcomes, columns are actual outcomes) looks like this:
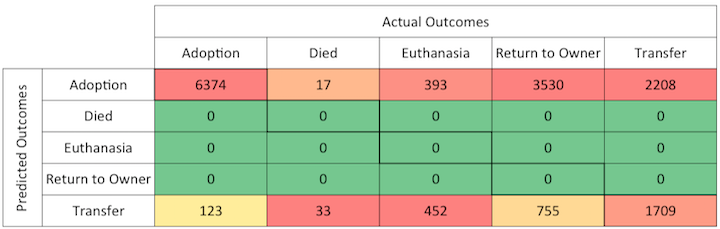
Note that an ideal outcome matrix will have the heaviest weights along the diagonal. However, when we add age, the outcome matrix looks like this:
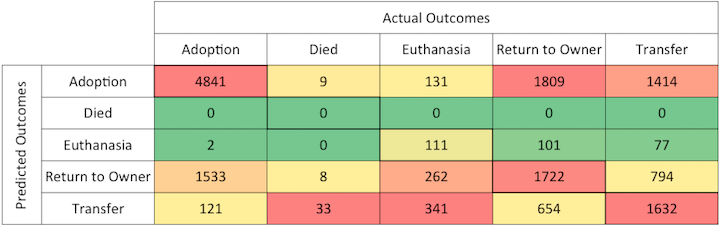
Notice how age allows our model to predict a far richer set of outcomes than the other factors alone.
Advice I would give a shelter based on this model. First, as I have already stated, is the value of finding a way to get pit bulls adopted. This could include education for owners to destigmatize the pit bulls, or obedience training for the dogs themselves. Second, since spayed and neutered animals are more likely to be adopted investing in spaying and neutering programs for the animals would be a worthwhile endeavor. If it results in more adoptions the costs could ultimately save the shelter money, as they would make more money in adoption fees. Finally, it would be so helpful for the shelter to find some way to move the elderly animals. I wonder if certain demographics of people (older individuals) would also be interested in older, more mellow dogs.
As a final note, splitting the data into dogs and cats allowed for an obvious test of my initial hypothesis, which was that dogs and cats would require different models for good prediction power. A quick outcome matrix when applying this method to cats (though cats could only be classified as mutt or pure bred, not pit bulls) yields this:
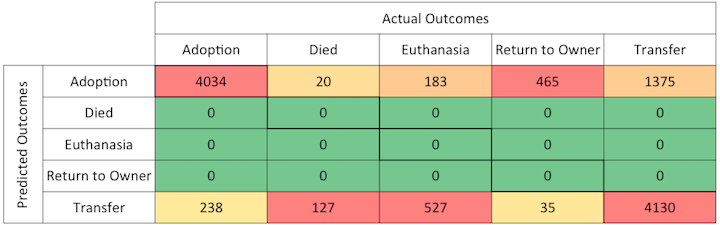
There is definitely explanatory power lacking when applying the dog model to cats. In the future, I will need to build an appropriate model for predicting outcomes of cats. This is also relevant to shelters, in that they should not assume that dogs and cats are similar. For example, it may be that older cats don’t suffer as much as older dogs. This remains to be explored in the data.
Also note, both of the pictured dogs are available for adoption at the Yolo County Animal Services Shelter as of the time of this posting!